Farzana Patel
Data Scientist| Psychologist| Lead Data Consultant
Experience
- OFFICE FOR NATIONAL STATISTICS, UK - Data Scientist (Senior Executive Officer)
- OMDENA, REMOTE- Junior Machine Learning Engineer
- MARUMA CONSULTANCY, INDIA- Lead Consultant (Data and Analysis)
- ACCENTURE, INDIA- Application Development Associate
Education
- MSC (Psychological Reaserach Methods with Data Science), The University of Sheffield, UK.
- Post-Grad Diploma (DataScience specialization in Deep Learning), IIIT- Bangalore, India.
- MA (Psychology), IGNOU, India.
- BE (Computer Engineering), MITCOE, India.
Languages and Technological skills
Python | R | Git | PowerBI | Tableau | SPSS | SQL ETL | Data science pipeline | Statistics | Time series | Experimental design | Hypothesis testing | ML | NLP | Deep Learning
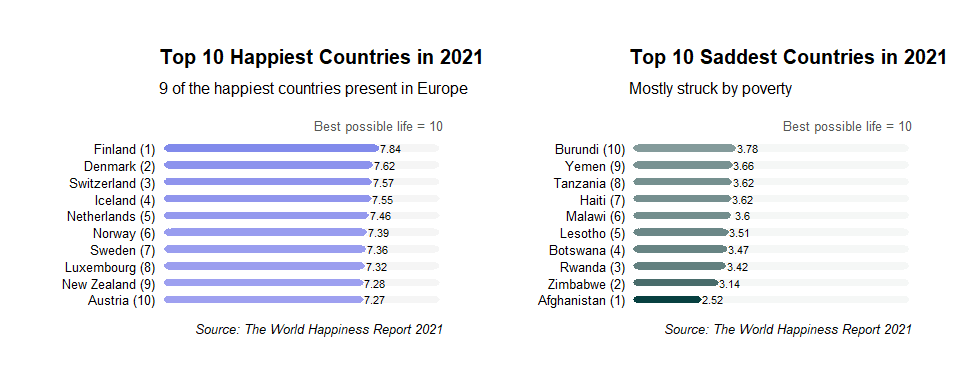
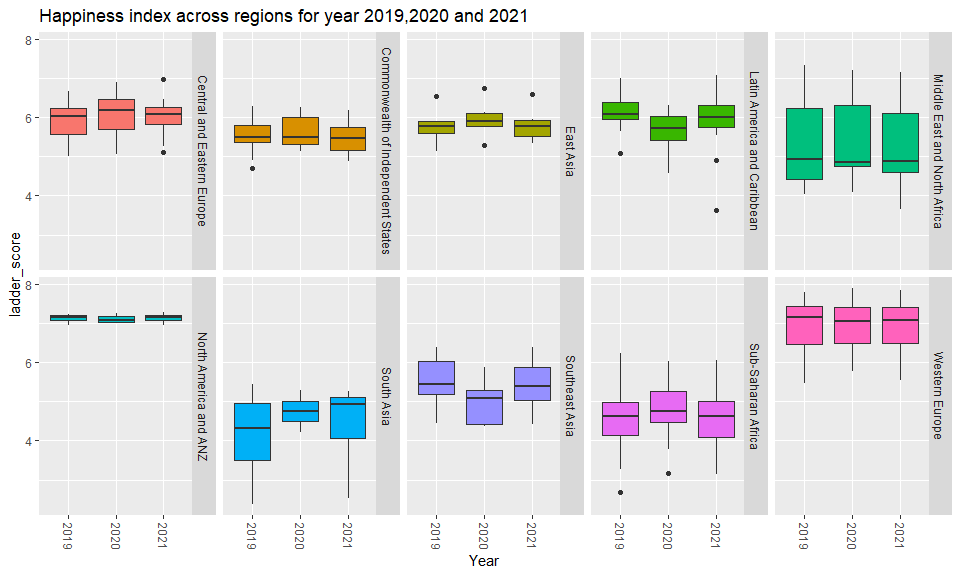
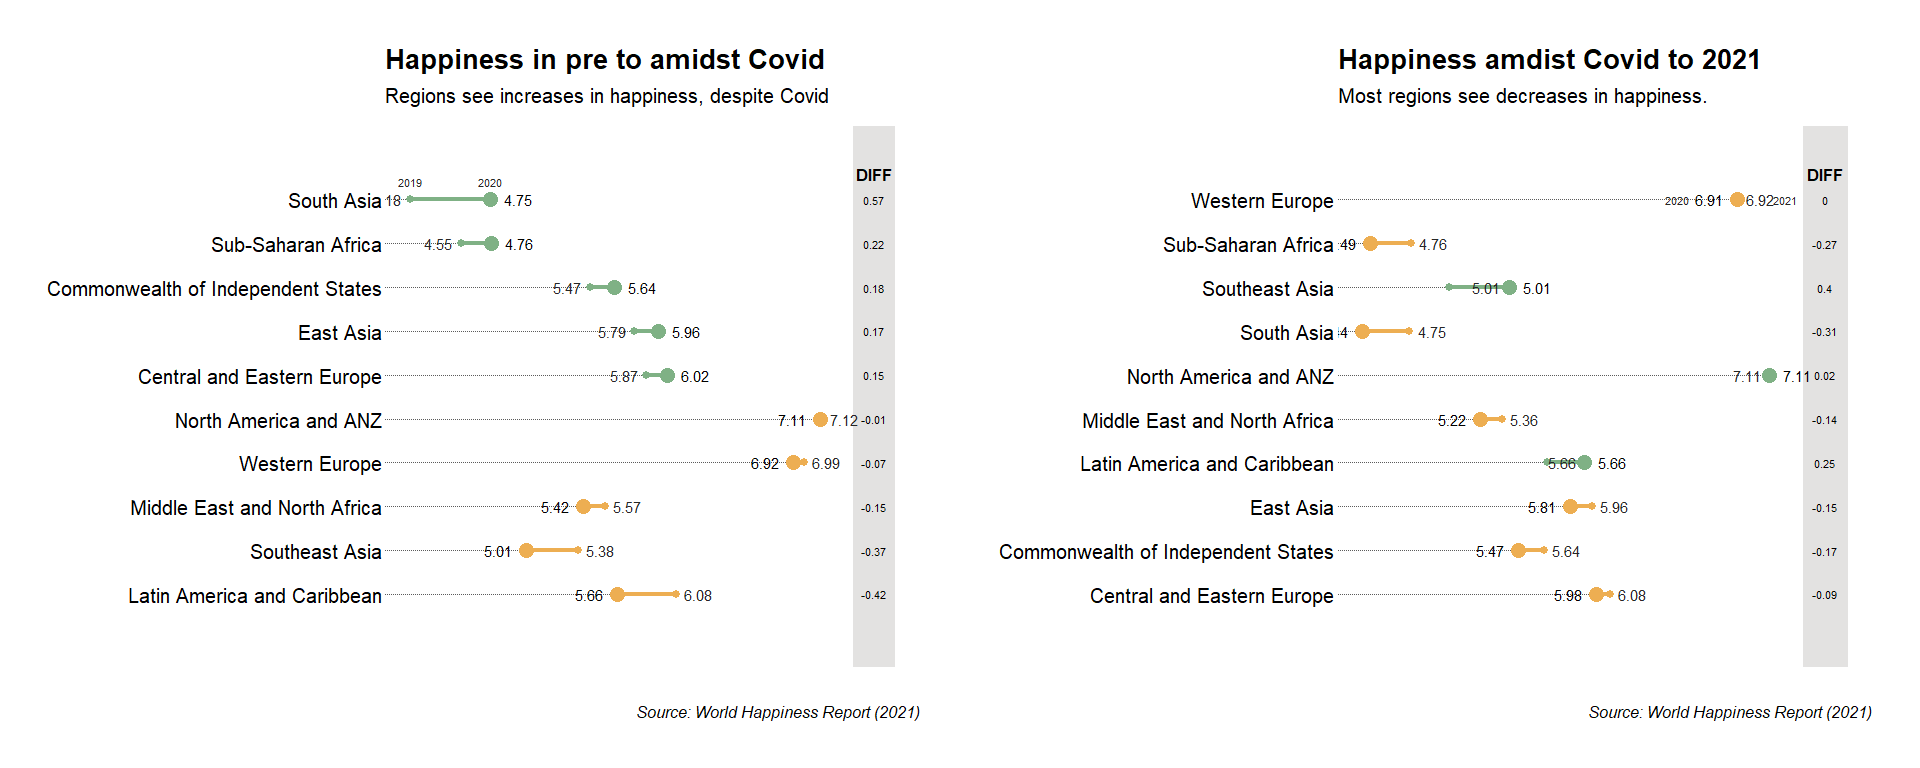
Project 1: World Happiness Report 2021
This project integrates various visulizations pertaining happiness scores across the globe along with other important parameters.
- R libraries used: Plotly, Renv, Dplyr, Tidyverse, Ggalt
- Input: Country, Year, Happiness Score, Regions
- Output: Happines trend during Covid.
- Key Insight: There was significant dip in happiness levels across the globe when Covid struck and it didn’t go back to original levels in 2021.
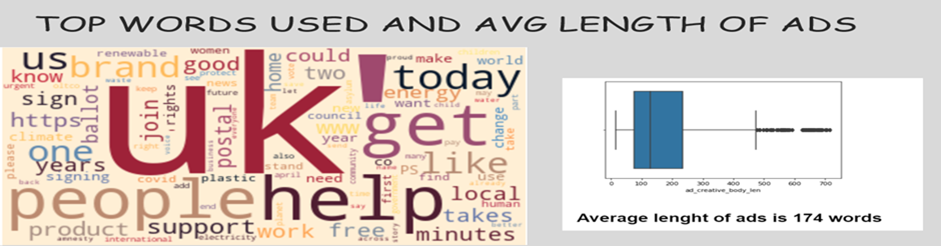
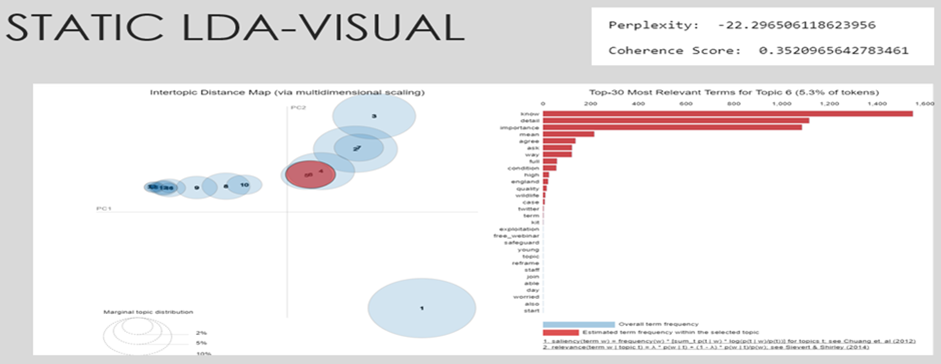
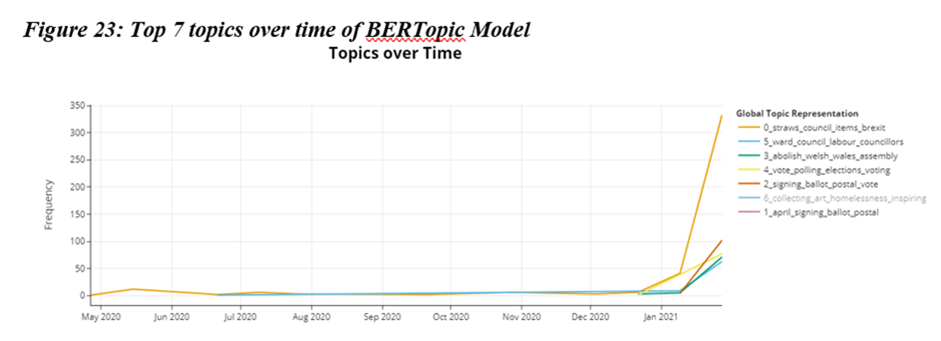
Project 2: Understanding the space of facebook political adverts using topic modelling.
The aim of this project was to understand the space of Facebook political adverts (i.e. by topic), as well as differences by timing, party, type of source (e.g. local political actors, campaigners, national parties) using automated content analysis, will provide meaningful insights of the inner workings of the political ad domain to the community.
In the project, I implemented topic modelling on political advert texts to detect latent topics and temporal trends with the dataset. By conducting a series of experiments, I finally landed on the optimal topic model I used to answer the research questions.
- Python libraries used:
- numpy==1.20.1
- pandas==1.2.4
- matplotlib==3.3.4
- seaborn==0.11.1
- nltk==3.6.1
- gensim==3.8.3
- spacy==3.1.1
- pyLDAvis==2.1.2
Project 3: Credit Card Fraud Detection
This project predicts fraudulent credit card transactions using machine learning models.
- Python libraries used: LogisticRegression, roc_auc_score, RandomForestClassifier,KMeans
- Input: Vectors, Amount, Class
- Output: Recall scores were used to identify best model based on their performance.
- Key Insights: Random forest is the best performing model and KNN performed the worst. So, I recommend using random forest to identify fraud transactions with current class imbalance dataset


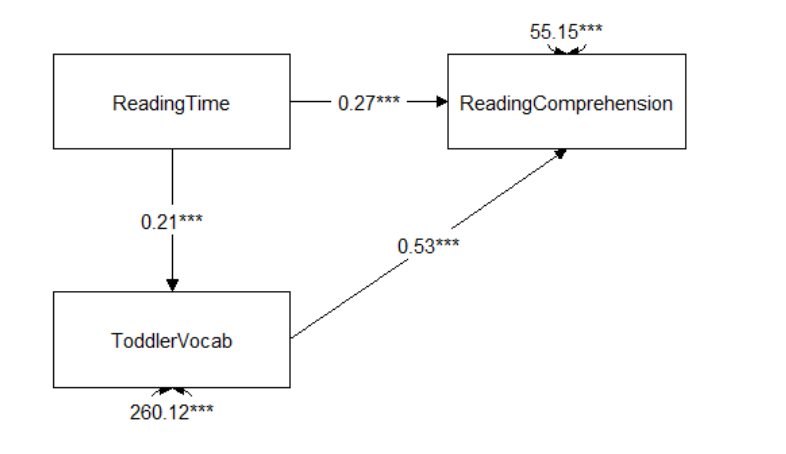
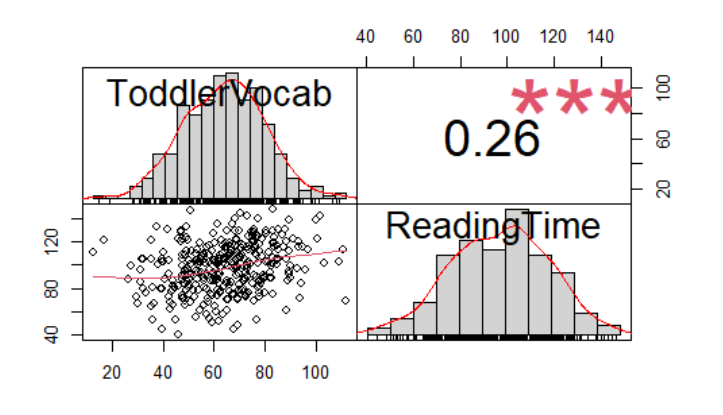
Project 4: Advanced Statistics- Investigation of knowledge and skill development in a lifetime
In this project, I investigated how people develop skills and knowledge throughout their lifetime. In particular, I investigated how language exposure impacts later linguistic skills, cognitive abilities, and academic achievement. The goal was to make several models, which quantify and test postulated theoretical assumptions. Previous studies in language acquisition showed that language skills depend on the richness of the environment as well as number of other factors. In the case of this exam, I focused on the question of how people learn language and whether this influences other outcomes, such as university enrollment.
- R libraries used: tidySEM, lavaan, statmod, semPlot, rcompanion, lme4, lmerTest, sjPlot, glmmTMB
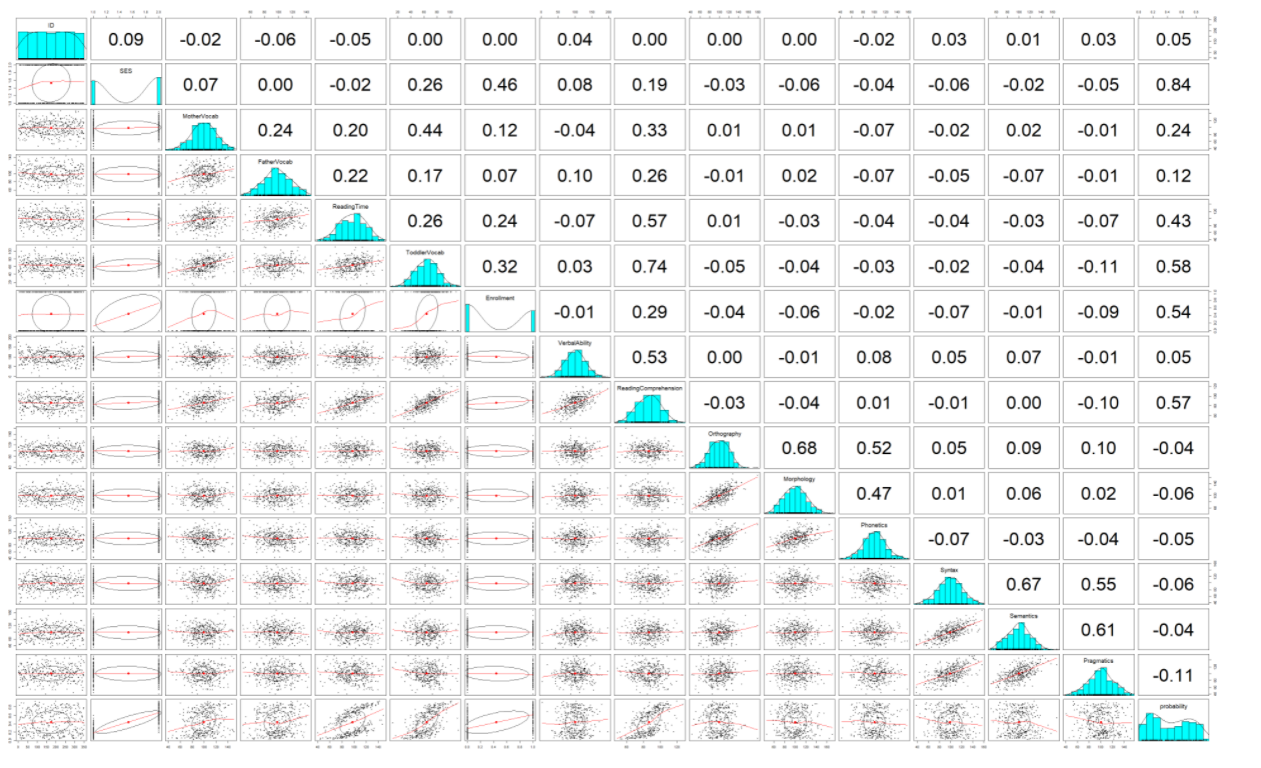
- Input: item_id, WordType, MotherVocab, FatherVocab, ReadingTime, ToddlerVocab, RT
- Models used: Linear Model, Structural Equation Model (SEM), Generalized Linear Model, Confirmatory Factor Model, Mixed Effect Model
- Key Insights:
- Toddler with mother with larger vocabulary will know 0.32 words more than the toddler with mother with smaller vocabulary, by every 1 unit increase in mother’s vocabulary and keeping all other variables constant. Slope of ReadingTime increases by 0.175596 for toddler from high SES background. That is toddlers from high SES background have high positive relationship between ReadingTime and ToddlerVocab as compared to low SES background toddlers.
- Prediction of university enrollment: SES was significant (β=2.129449, p= 2.58e-14). Hence, null of no effect is rejected. So, it can be stated that, SES measure is predictive of enrollment.ReadingTime was significant (β= 0.027840, p= 4.80e-05). Hence, null of no effect is rejected. So, it can be stated that, ReadingTime measure is predictive of enrollment.ToddlerVocab was significant (β= 0.025196, p= 0.0029). Hence, null of no effect is rejected. So, it can be stated that, ToddlerVocab measure is predictive of enrollment.It can be stated that high SES individuals are 8.41 times more likely to enroll at a university.
SEM Model output:
Generalized Model prediction:
Full GLM prediction:
Project 5: Car Price Prediction
An automobile consulting company wants to understand the factors on which the pricing of cars depends.The model prediction will be used by management to understand the pricing dynamics of a new market.
- Python libraries used: LinearRegression, RFE, sm
- Input: Car price, car types, car specifications
- Output: Linear model that explains the most variance with significant predictors.
- Key Insights: Linear model fits the best here with 90% variance explained by r-squared(0.899) and adjusted r-squared (0.896).P-values of the model is less than 0.05 which validates that predictors are statistically significant
Scatterplot of all numeric datapoints:

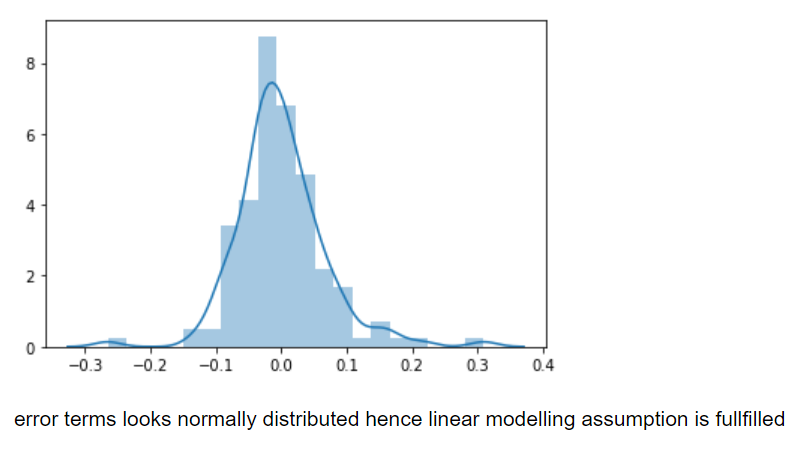
Residual plot:
Linear Model prediction:

Let's connect and chat! Open to anything under the sun.

